ILEVIA Server Web Interface
INTRODUCTION
This guide provides an overview of the Ilevia X1 Plus interface and the main tools available for managing your server.
After reading this guide, you will be able to diagnose the server status, view and modify its network and IP settings, and update the Ilevia X1 Plus server independently when required.
The following sections will guide you through these procedures step by step, helping you perform basic configuration and maintenance tasks safely and efficiently.
X1 Plus server interface
Login Page
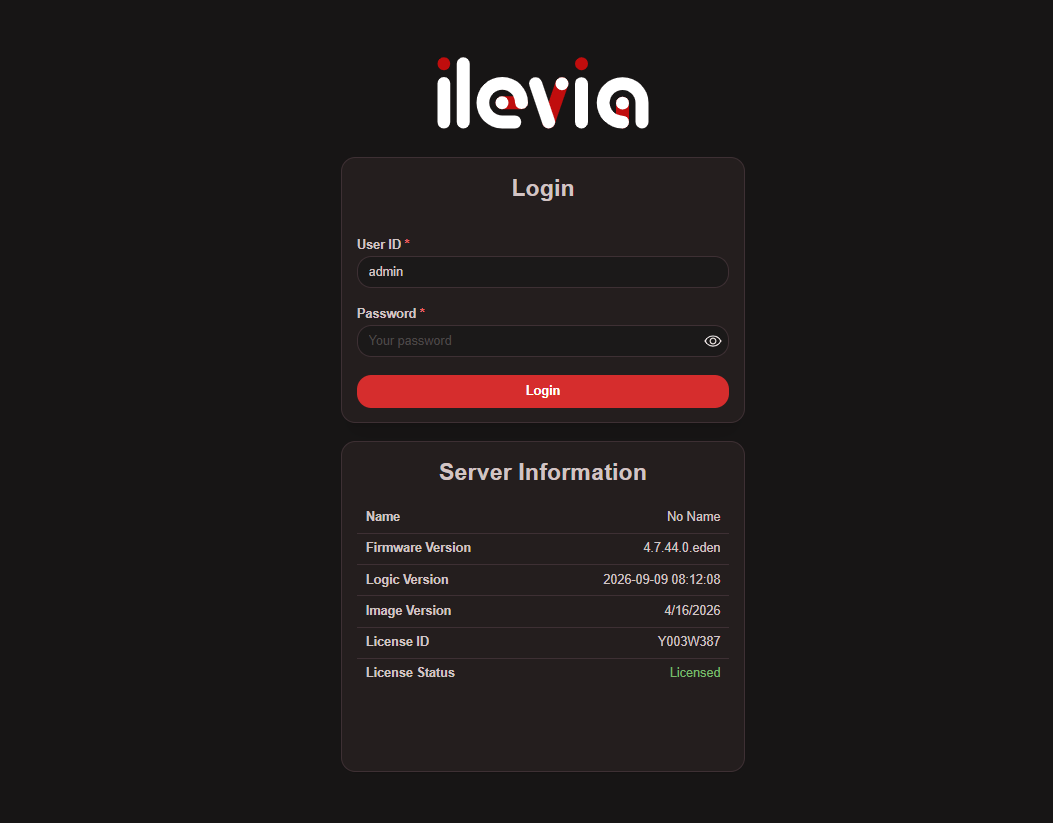
Open a web browser and enter the server’s IP address to access the web interface.
Dashboard
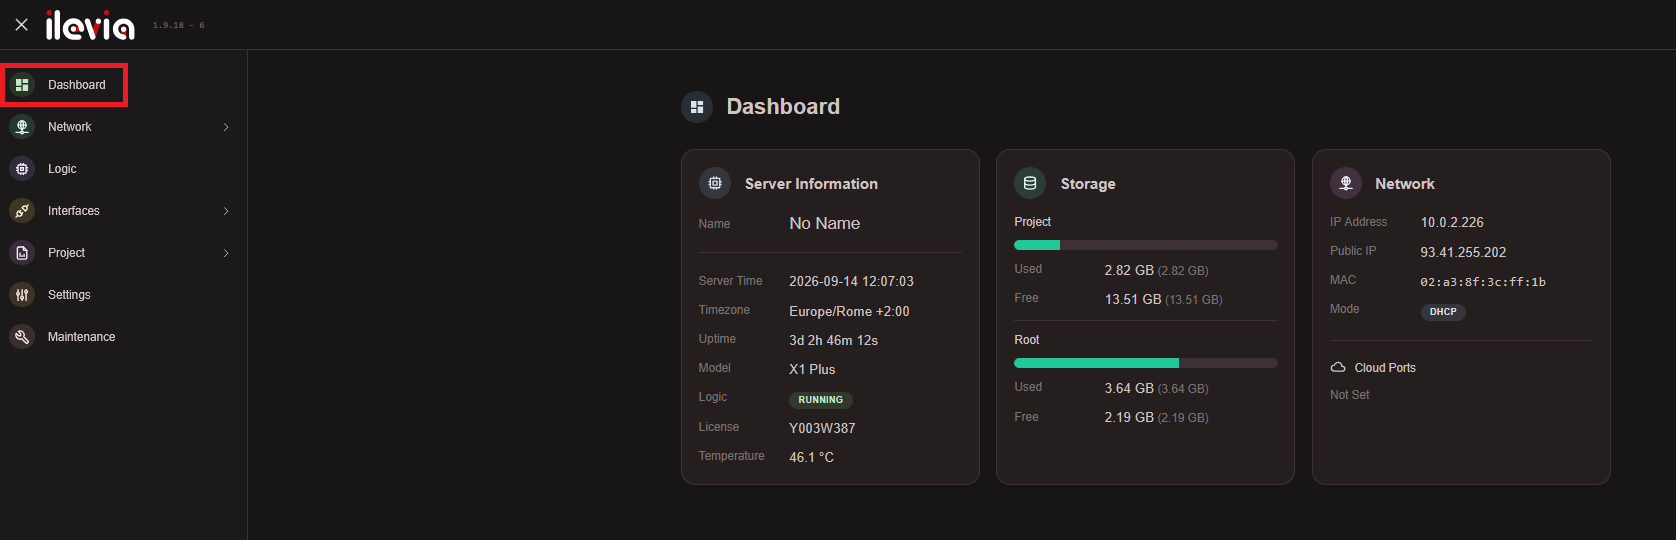
– Server information
View the server ID, operating status, uptime, temperature, and license information.
– Storage
View the used and available storage for the Project and Root partitions.
– Network
View the server’s IP addresses, MAC address, network mode, and configured communication ports.
Network
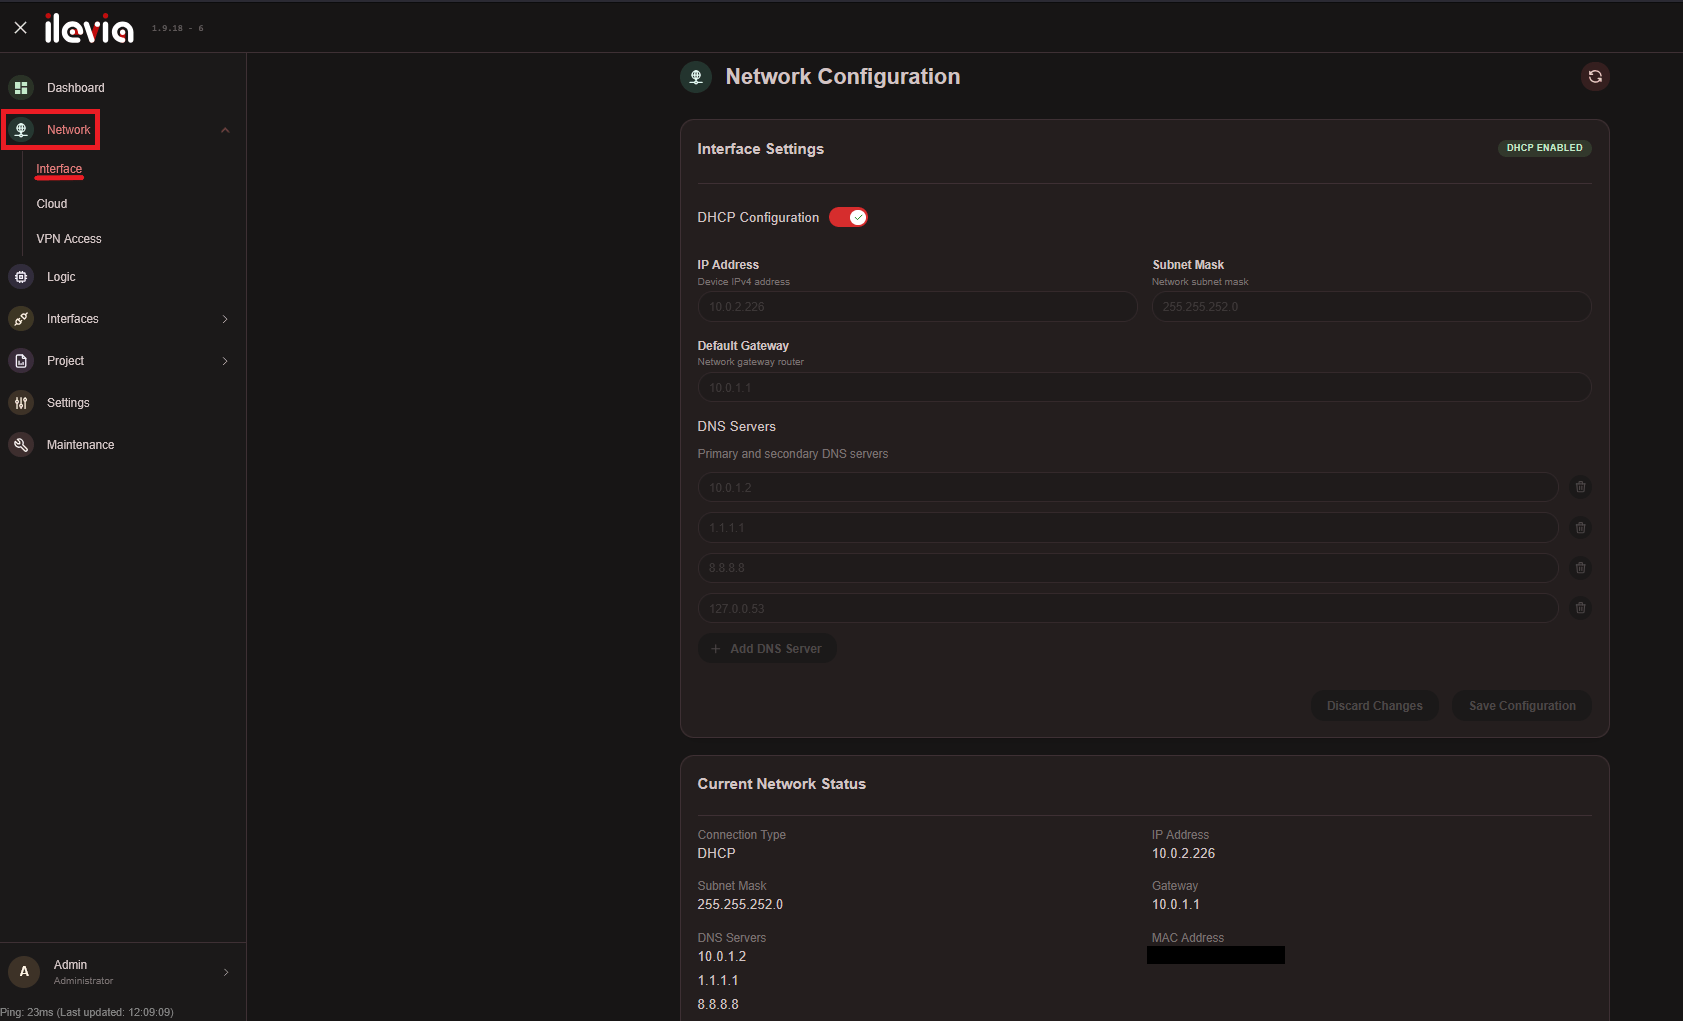
– Interface
Configure the server’s network connection. Use DHCP to obtain network settings automatically, or configure a static IP address, subnet mask, gateway, and DNS servers manually.
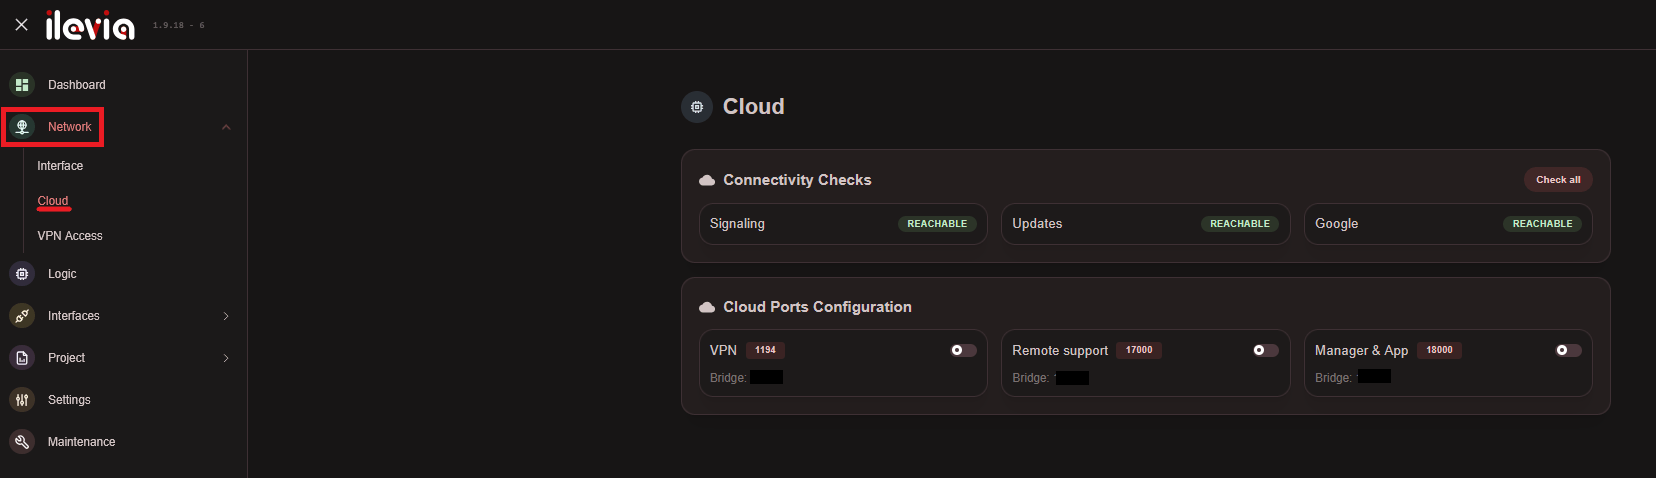
Use the Cloud page to manage the services available on the ILEVIA server. View their connection status and enable or disable each service as needed.
Available services include VPN Access, Remote Support, and Manager & App. Each service can be enabled independently.
Port information and connectivity checks help confirm that the server can reach the required cloud endpoints.
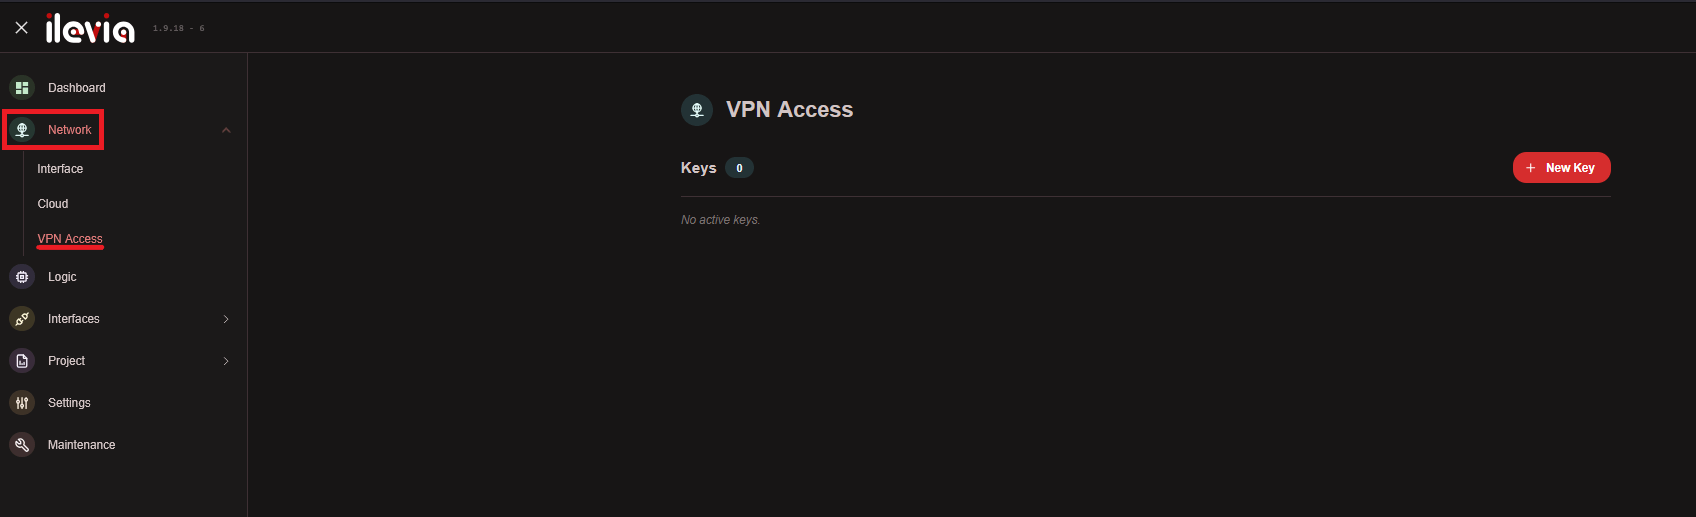
Use the VPN Access page to create and manage Headscale VPN keys. These keys securely authenticate a remote device and connect it to the same network as the ILEVIA server.
Select New Key to generate a VPN key for the connection setup. For more information, see the guide to configuring Tailscale VPN with ILEVIA.
Logic
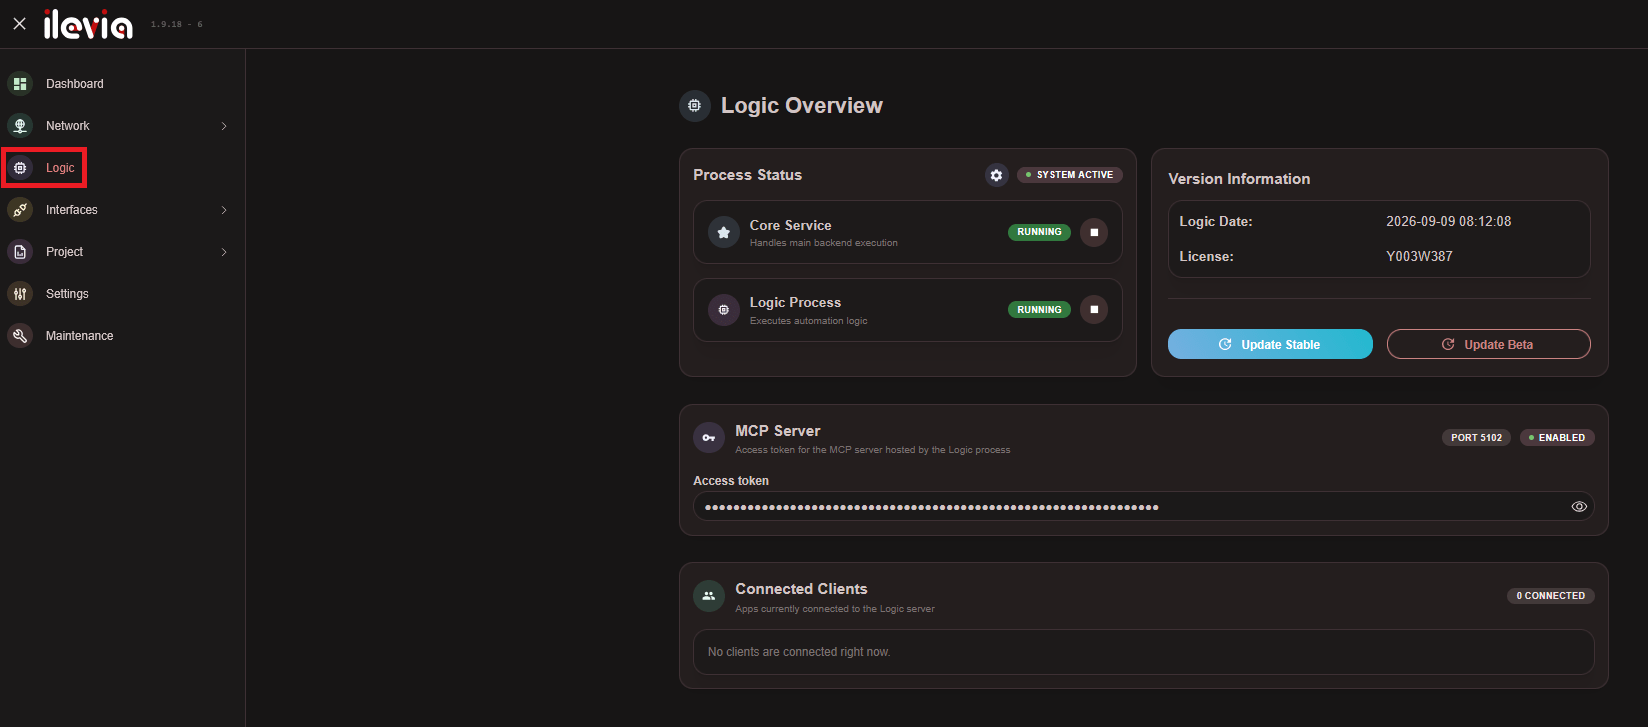
The Logic Overview interface allows you to monitor and manage the main services running on the Ilevia X1 Plus server. From this page, you can check the status of the Core Service and Logic Process, view the installed Logic version and license information, and update the server using either the Stable or Beta software release.
The interface also provides information about the MCP Server, including its connection port and access token, and displays the number of clients currently connected to the Logic server. These tools can be useful for diagnosing the server status and verifying that its main services and external connections are operating correctly.
Interfaces
– KNX
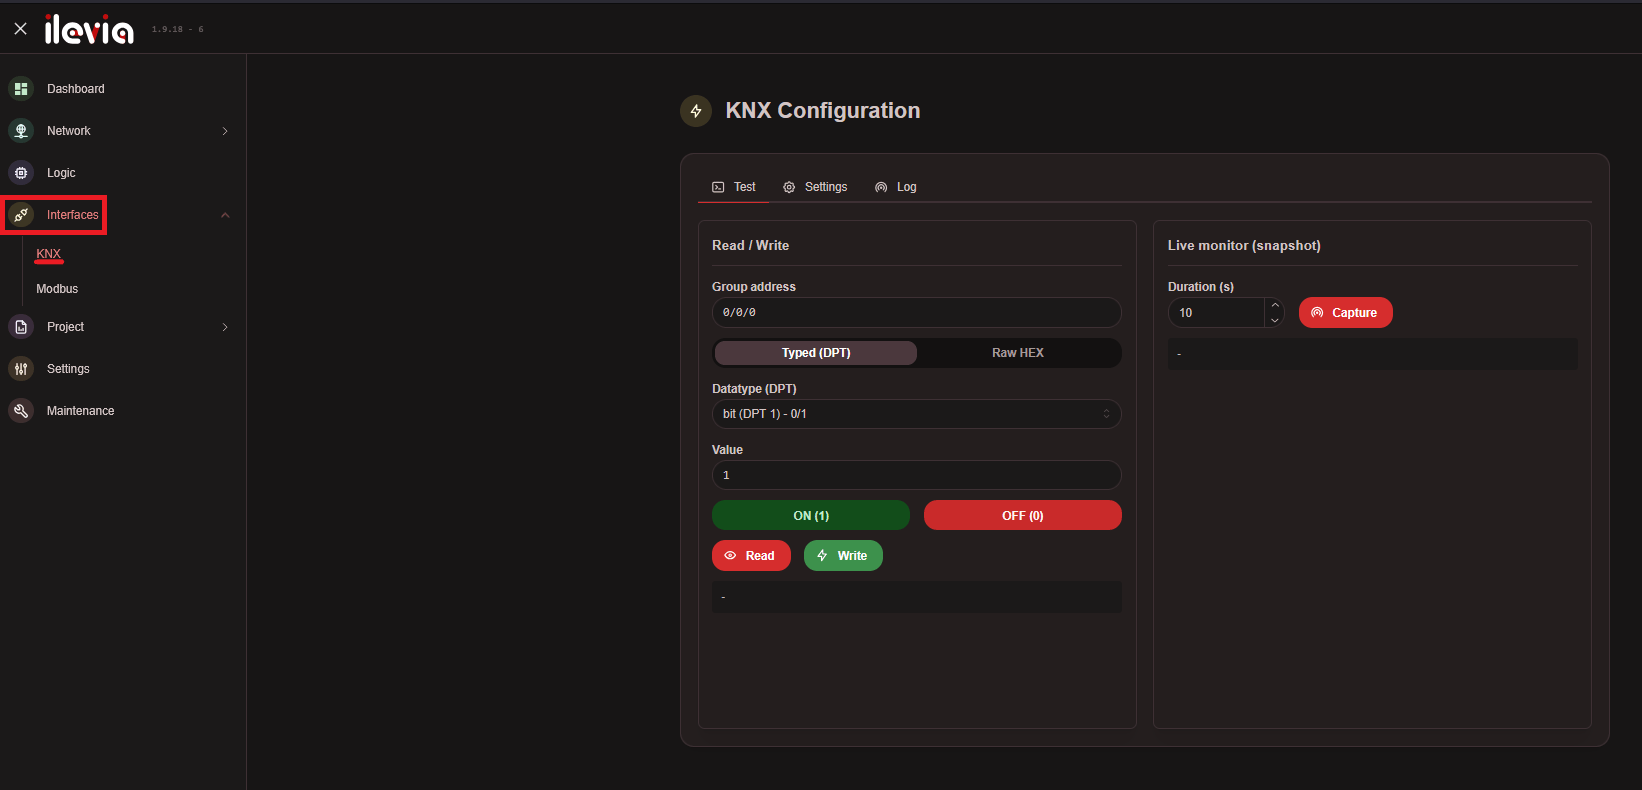
Use the KNX Configuration page to read from and write to specific KNX group addresses. The KNX Bus Monitor captures telegrams exchanged on the bus for testing and troubleshooting.
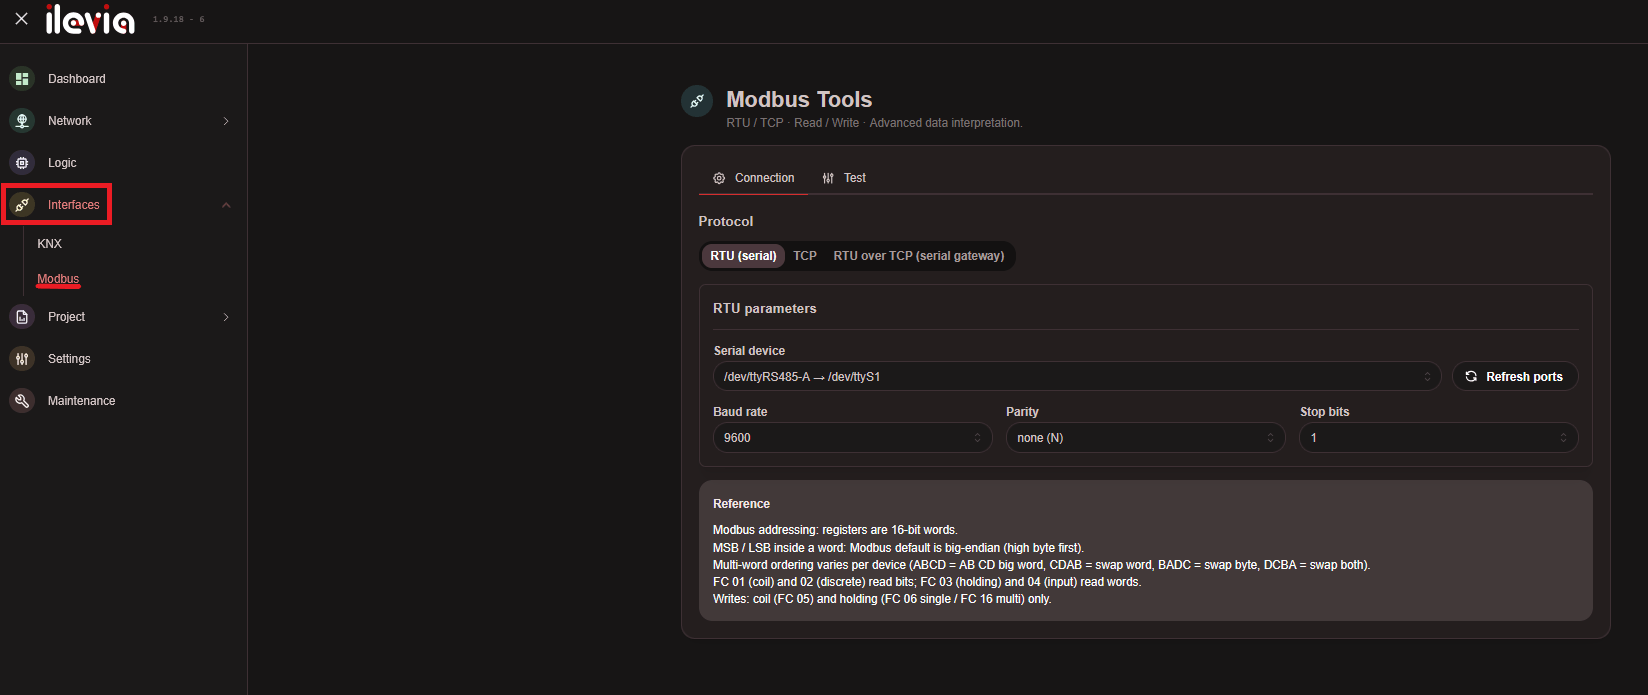
Use the Modbus Tools page to configure a Modbus RTU or TCP connection and read or write registers in real time. You can also test communication with connected devices and verify register values directly from the ILEVIA server.
Project
– Overview
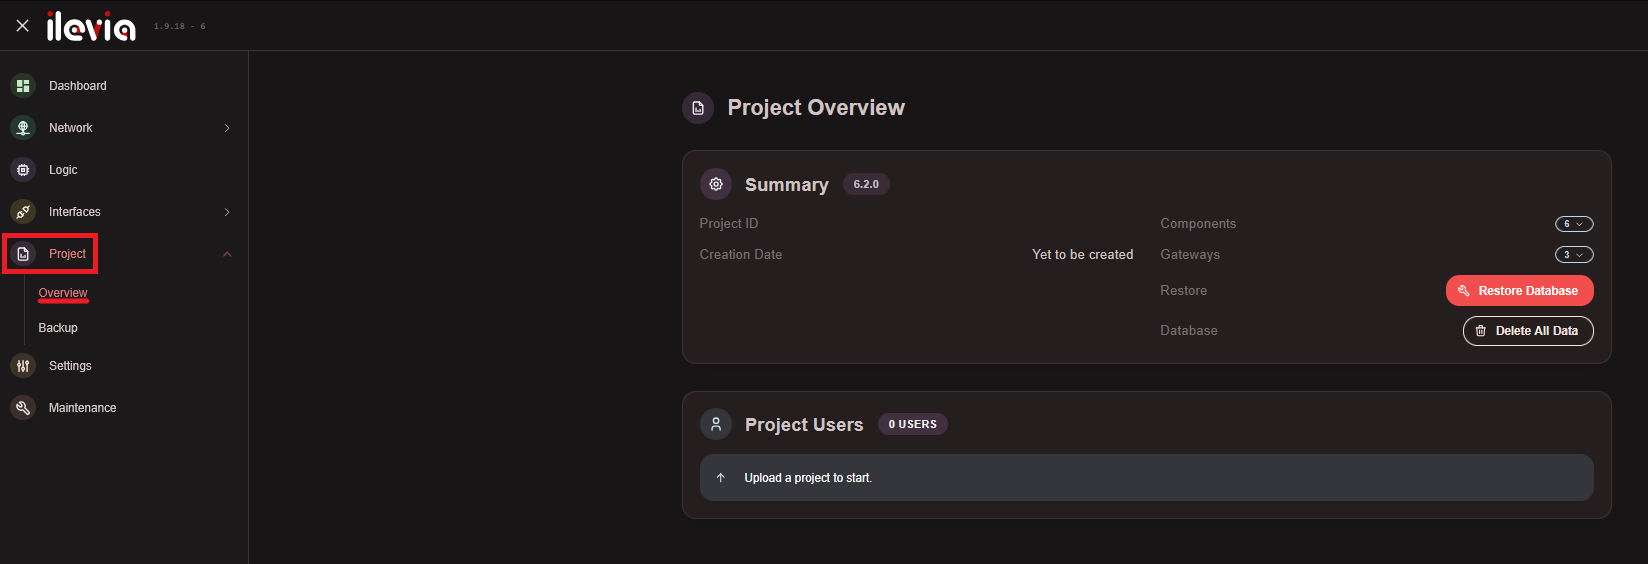
View the number of components and gateways in the current project. You can also reset the project database to its default state or delete all project data.
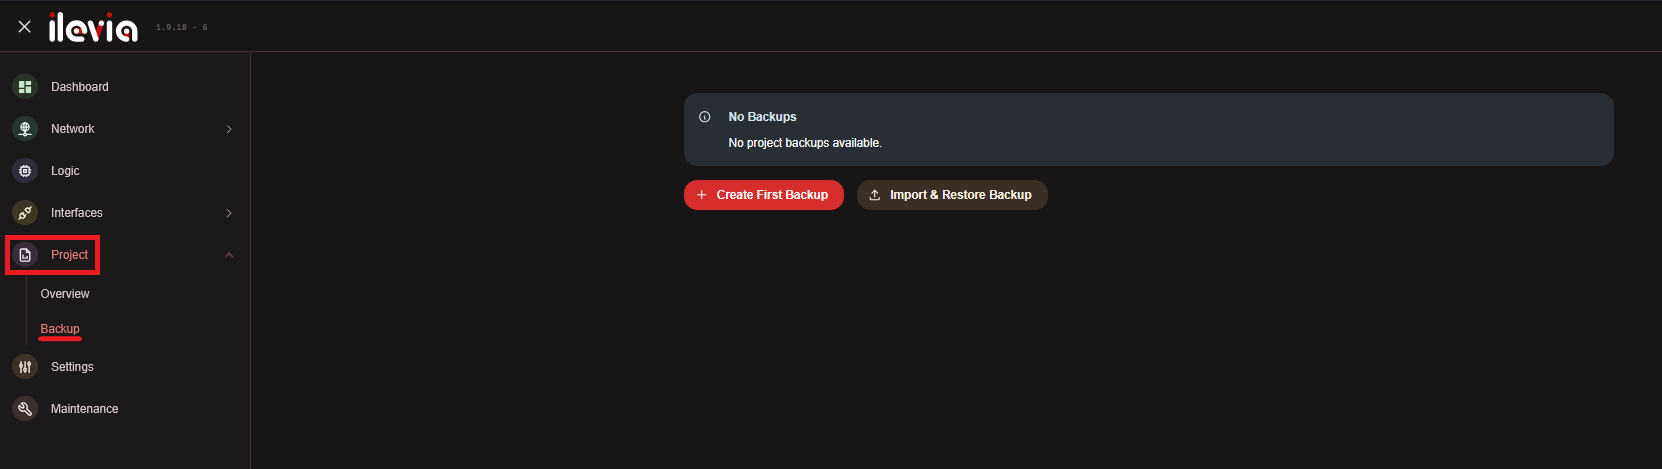
Create a backup of the current project and other relevant server data. You can also import and restore an existing backup.
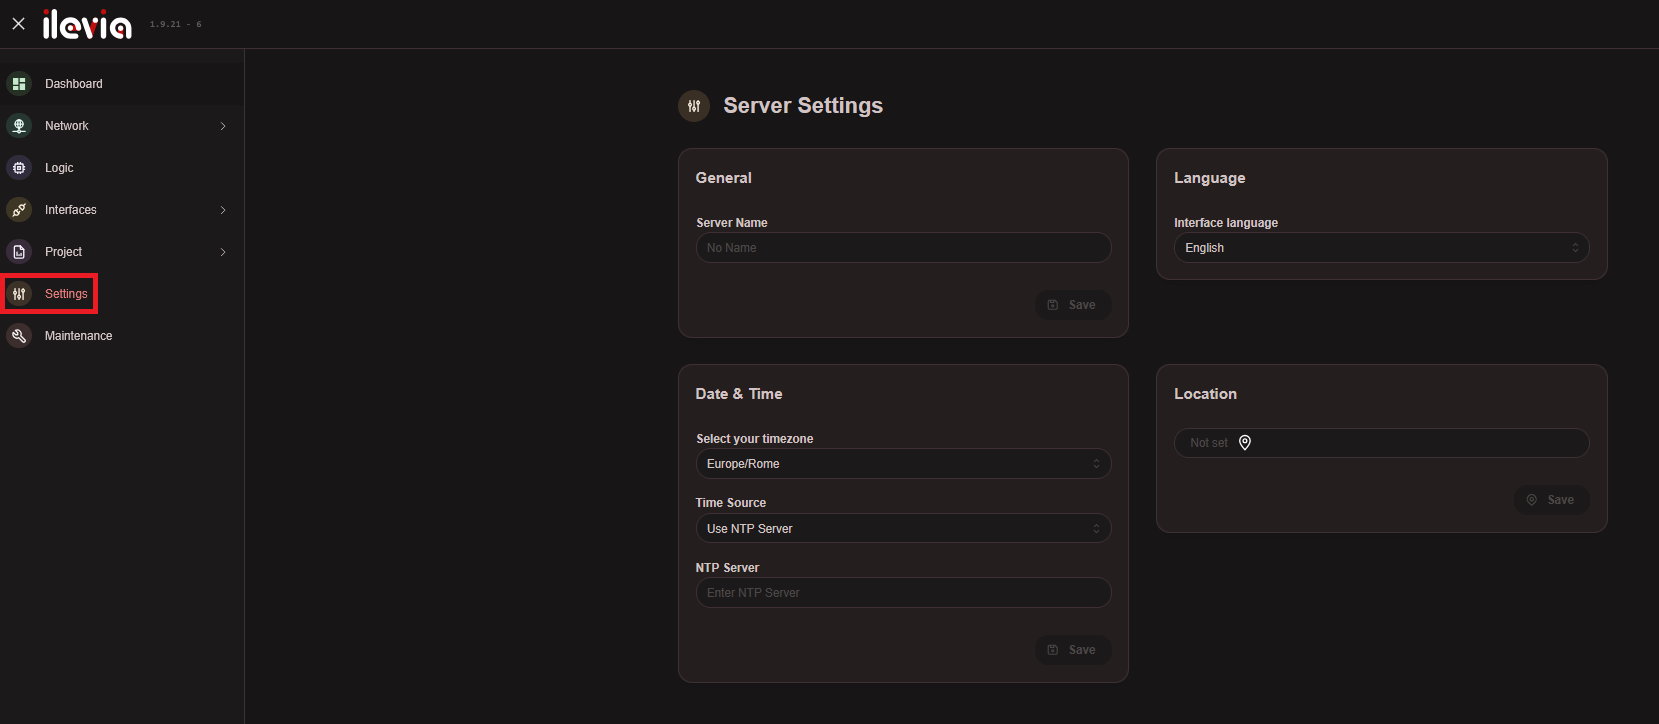
Configure the server name, time zone, time settings, and web interface language.
Maintenance
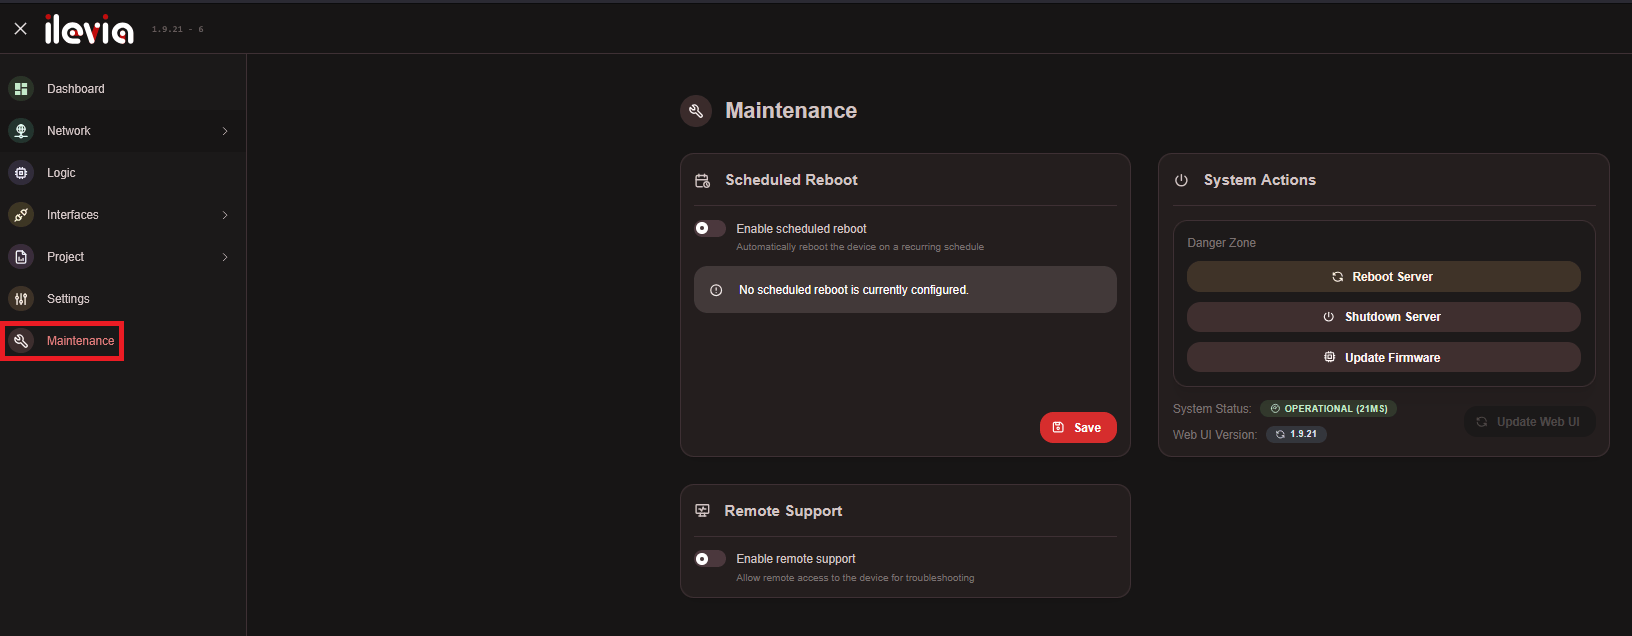
In this menu you can: Schedule automatic reboots, enable remote support, reboot or shut down the server, and update the web interface.