 ENERGY DATA
INTRODUCTION
With this component you can monitor the Power and Energy production and consumption. The component allows, also, the analysis of the real cost of the consumed energy.
In order to have a correct data monitoring, you must have at least two Energy meters installed in the plant!
COMPONENT PROPERTIES
Energy units: This parameter allows to choose in which format the Energy data will be shown.
Grid instant power: Link a info or a Changeable Value component that will display the current instant power coming from the Grid.
Grid energy import: Link a info or a Changeable Value component that displays the energy value imported from the Grid.
Grid energy export: Link a info or a Changeable Value component that displays the energy value exported from the plant to the Grid.
Consumption power: Link a info or a Changeable Value component that displays the power consumption of the plant.
Consumption energy: Link a info or a Changeable Value component that displays the energy consumption of the plant.
Production power: Link a info or a Changeable Value component that displays the value of the power production of the plant.
Production energy: Link a info or a Changeable Value component that displays the energy production of the plant.
Battery power: Link a info or a Changeable Value component that displays the battery value of the batteries connected to your plant.
Battery energy charge: Link a info or a Changeable Value component that displays the value of the charging state of the battery in your plant.
Battery energy discharge: Link a info or a Changeable Value component that displays the value of the discharging state of the battery in your plant.
Battery charge level: Link a info or a Changeable Value component that displays the charging level of the battery of your plant.
Electric vehicle power: Link a info or a Changeable Value component that displays the current vehicle power level.
Electric vehicle energy usage: Link a info or a Changeable Value components that display the value o the power consumed by the electric vehicle connected to the plant.
Electric vehicle energy charge: Link a info or a Changeable Value component that displays the energy charge value of the electric vehicle connected to the plant.
Electric vehicle charge level: Link a info or a Changeable Value component that displays the current charge level of the electric vehicle connected to the plant.
KWh price: In this parameter you are asked to enter the exact value of the Energy KWh price.
KWh price unit: In this parameter you are asked to enter the price of the KWh per unit.
Loads Info: Add the Loads components that will be displayed on the Energy overview component user interface.
Production info: Add the info components that represents the production value within the Energy overview component user interface.
Battery info: Add the info components that represents the Battery state within the Energy overview component user interface.
Component overview
Fluxes section
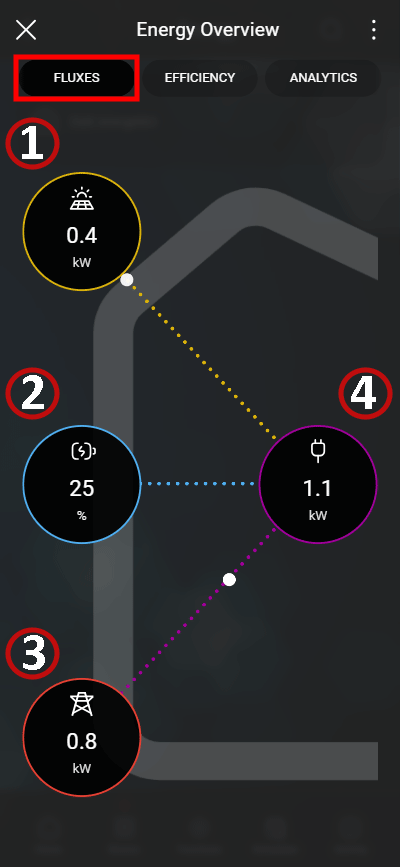
The following image represents the Energy overview user interface. 1. This widget represents the power production coming from the Solar panels. 2. This widget represents the Battery storage percentage. 3. This widget represents the power coming and going to the Grid. 4. This widget represents the power consumption of the House plant.
Public grid
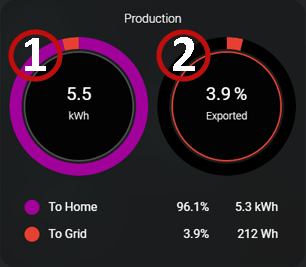
Click the Public grid widget to consult the Energy export to public grid.
Power consumption
Click the Power consumption widget to consult the power consumption of each load.
Efficiency section
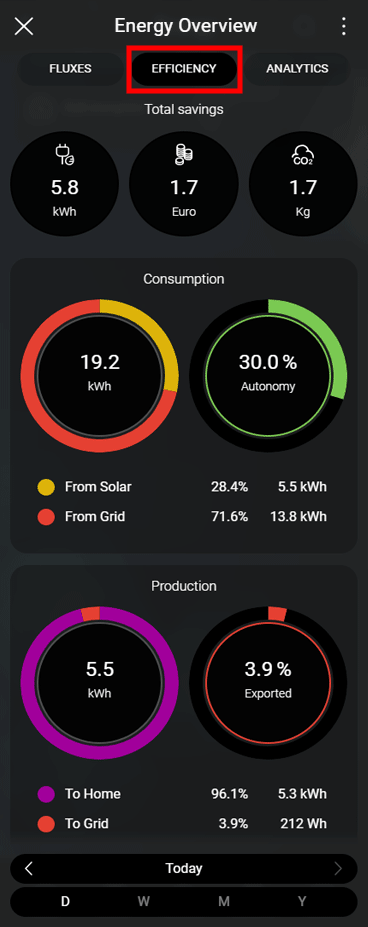
This tab of the Energy overview shows the overall values on a specific period of time.
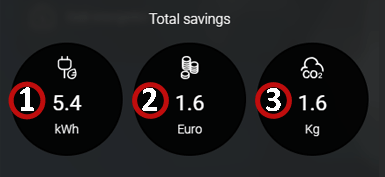
Total saving
Consumption
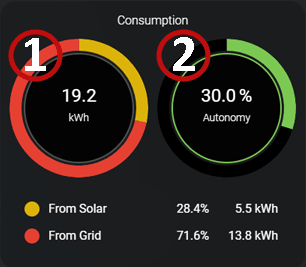
1. The first widget on the left represents the amount of power production coming from the solar panel and the amount of power taken from the grid. 2. This widget represents the Autonomy you have with the power production coming from the Solar panel.
Production
Analytics
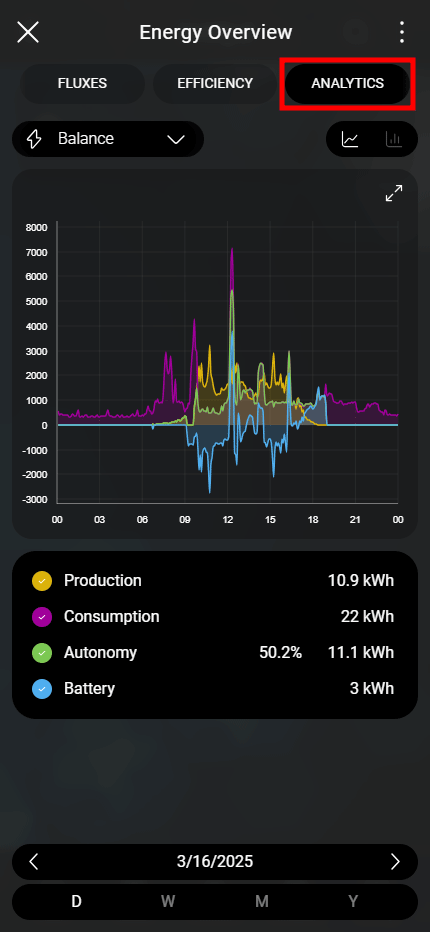
This tab of the Energy overview component allows to compare and analysis of the data recorded by the server of the Power / Energy production and consumption.
Drop down
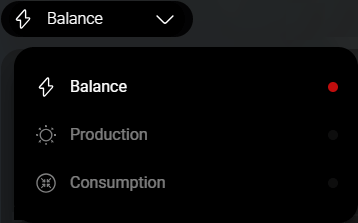
This drop down allows to switch between the data recorded from the server Ilevia. The Balance section allows to compare the several value coming from the house plant. The Production section will display the production data recorded. Finally the Consumption section will display the consumption data recorded by the server.
Chart
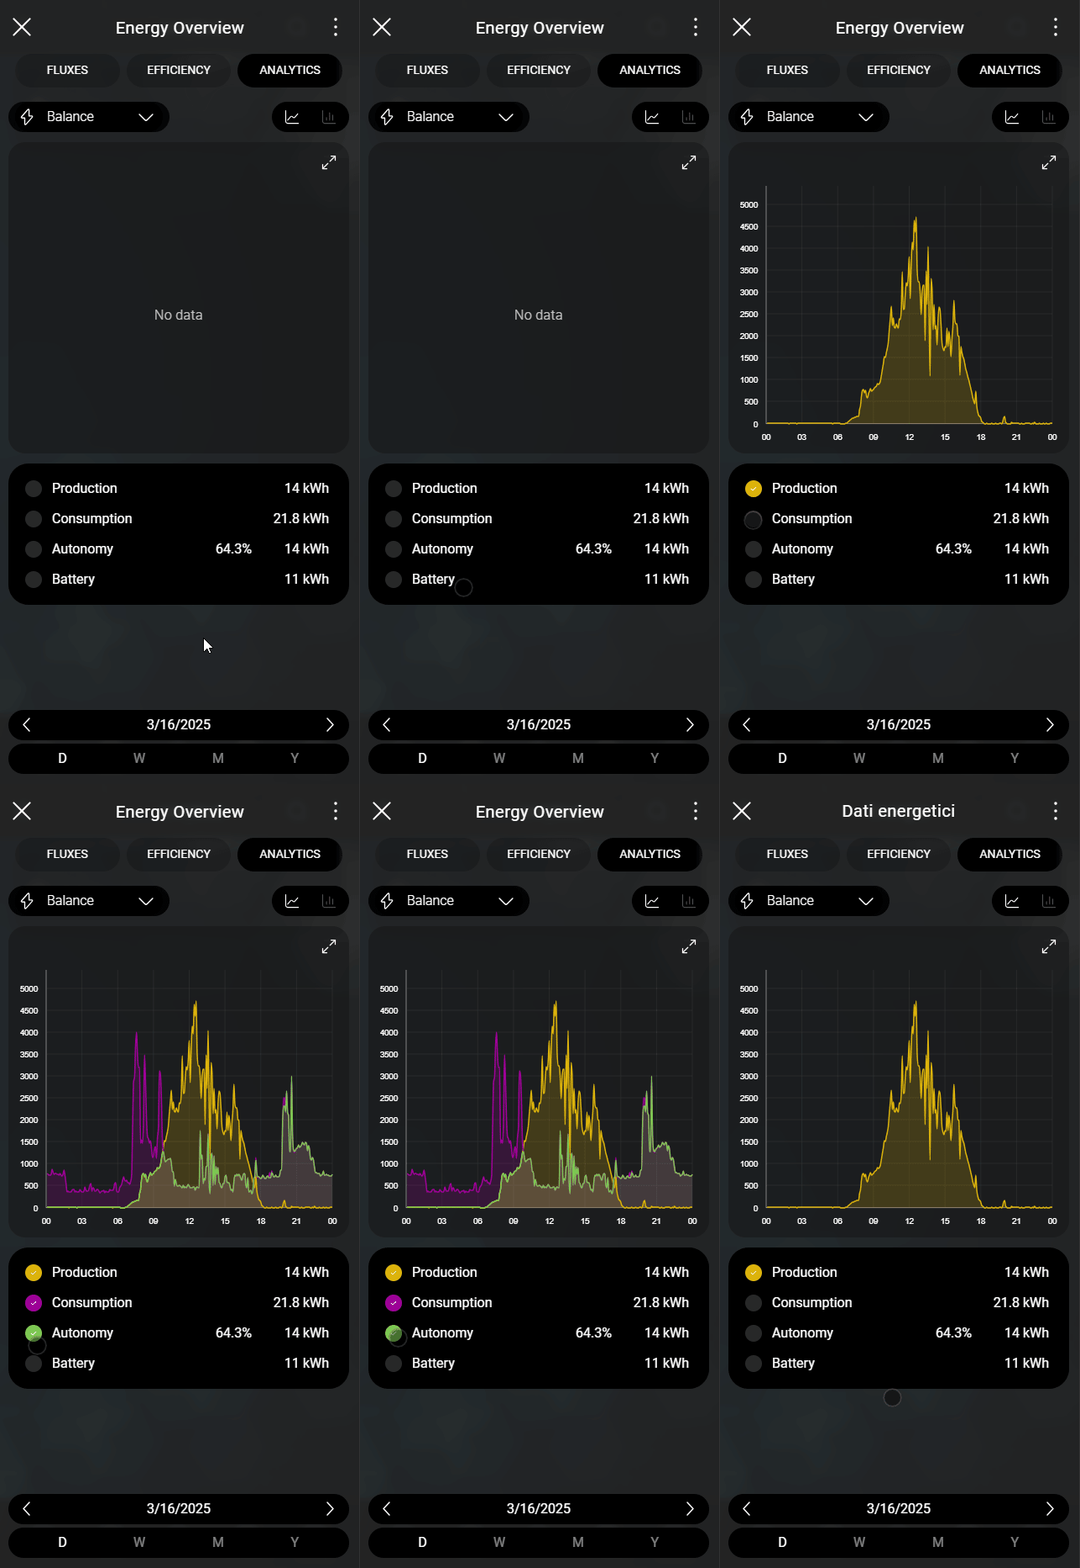
The chart shows the data recorded within the Ilevia server regarding the Energy/Power production, consumption, Autonomy and Battery value. 2. By ticking the checkboxes displayed on the right side of the Item, this allows the user to filter between the data displayed in the chart.
Timelapse
You can also change the time lapse of the values shown above to compare the data over time.


