REAL TIME CHART
INTRODUCTION
This component allows to consult the data of a specific component in real time. This component could be used. for example, to consult real time power consumption of an appliance.
Note! This component works only in the Map user interface.
Component properties
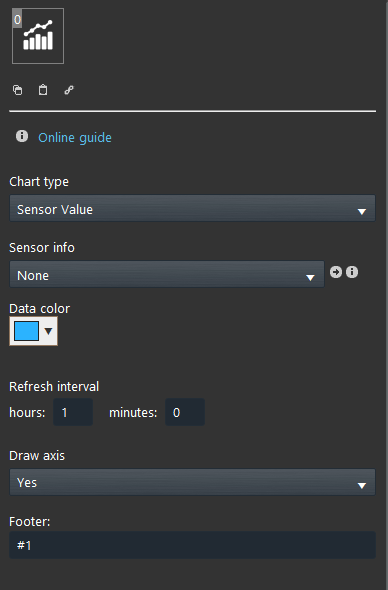
Chart type: Choose here the type of chart type.
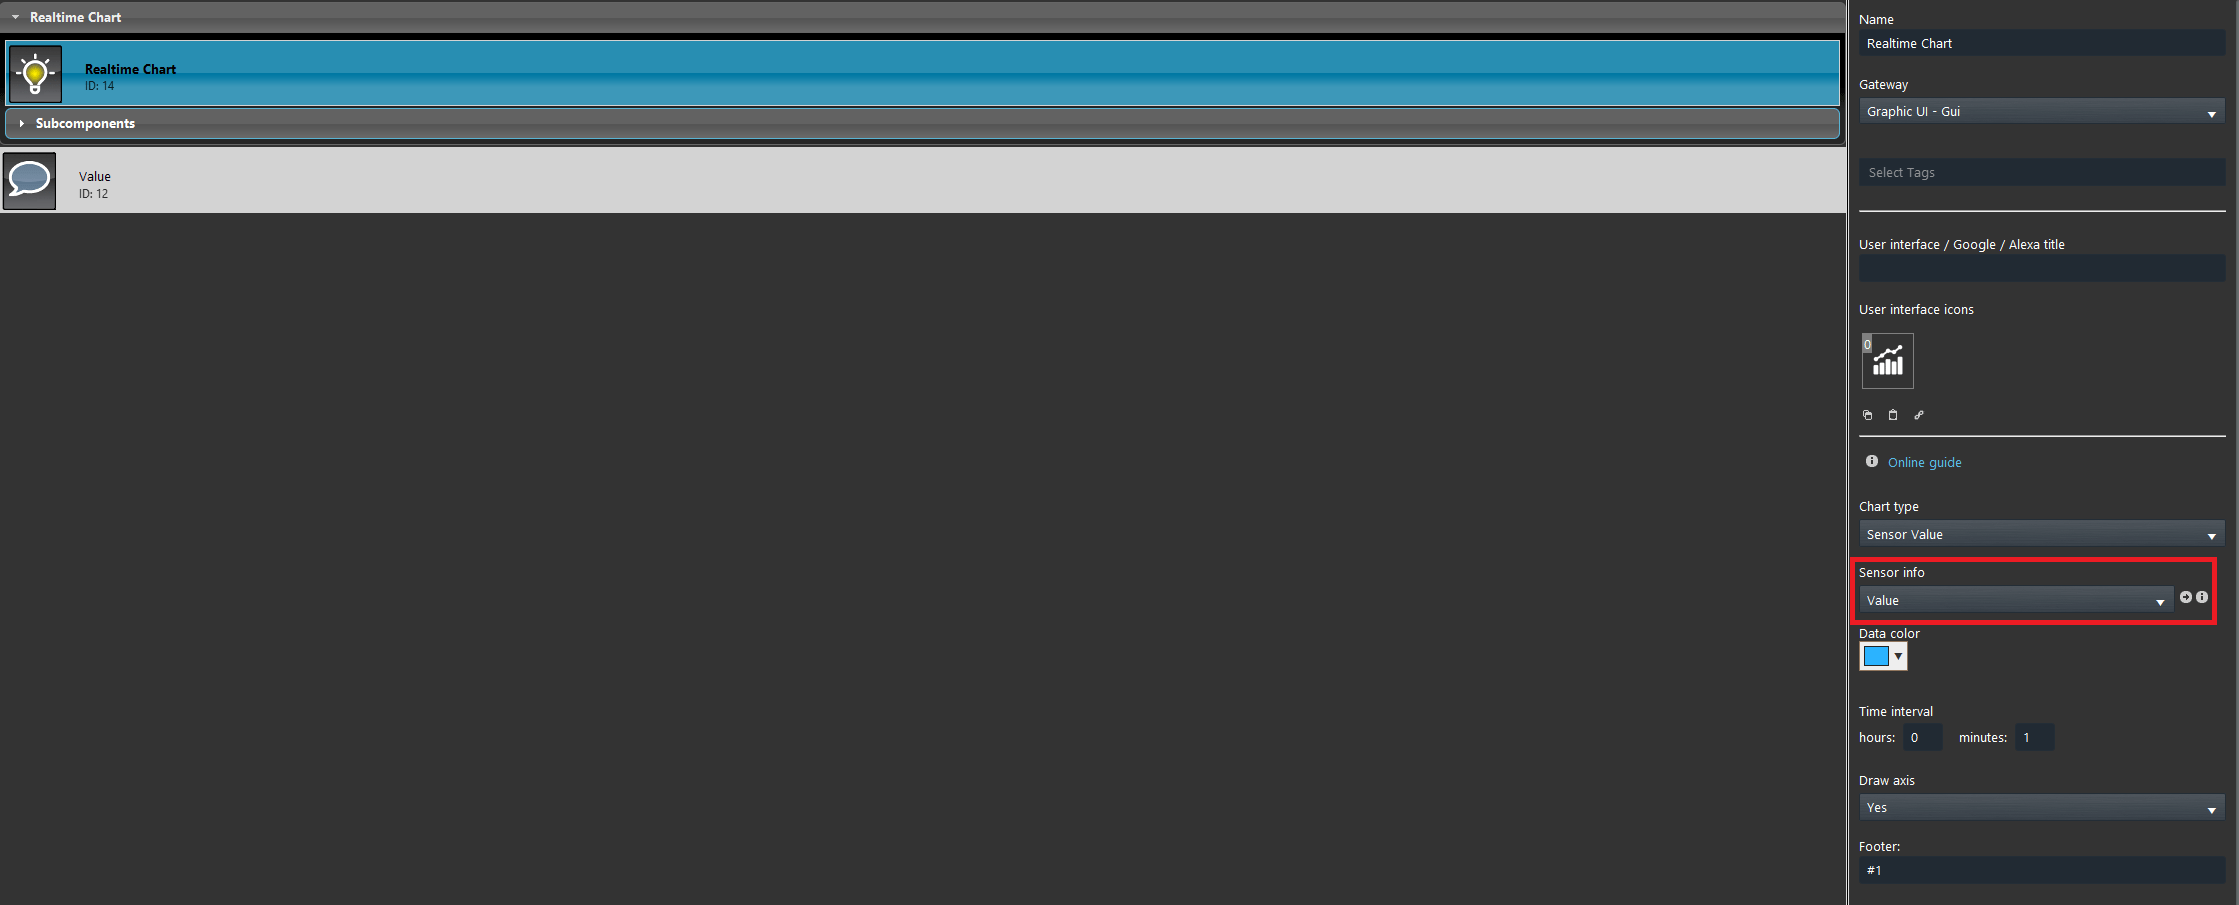
Sensor info: Link here the component that will be displayed within the Real time chart.
Data color: Here select the Chart’s data color.
Refresh interval: Here set the refresh interval which will be applied to the data value displayed within the Real time chart.
Draw axis: This option allows to choose if the axis within App interface.
Footer: Enter here the text that will be added on the footer side of the Real time chart.
Component configuration
Link the Info component on the Sensor info parameter. This will be displayed within the Real time chart inside the Ilevia control interface.
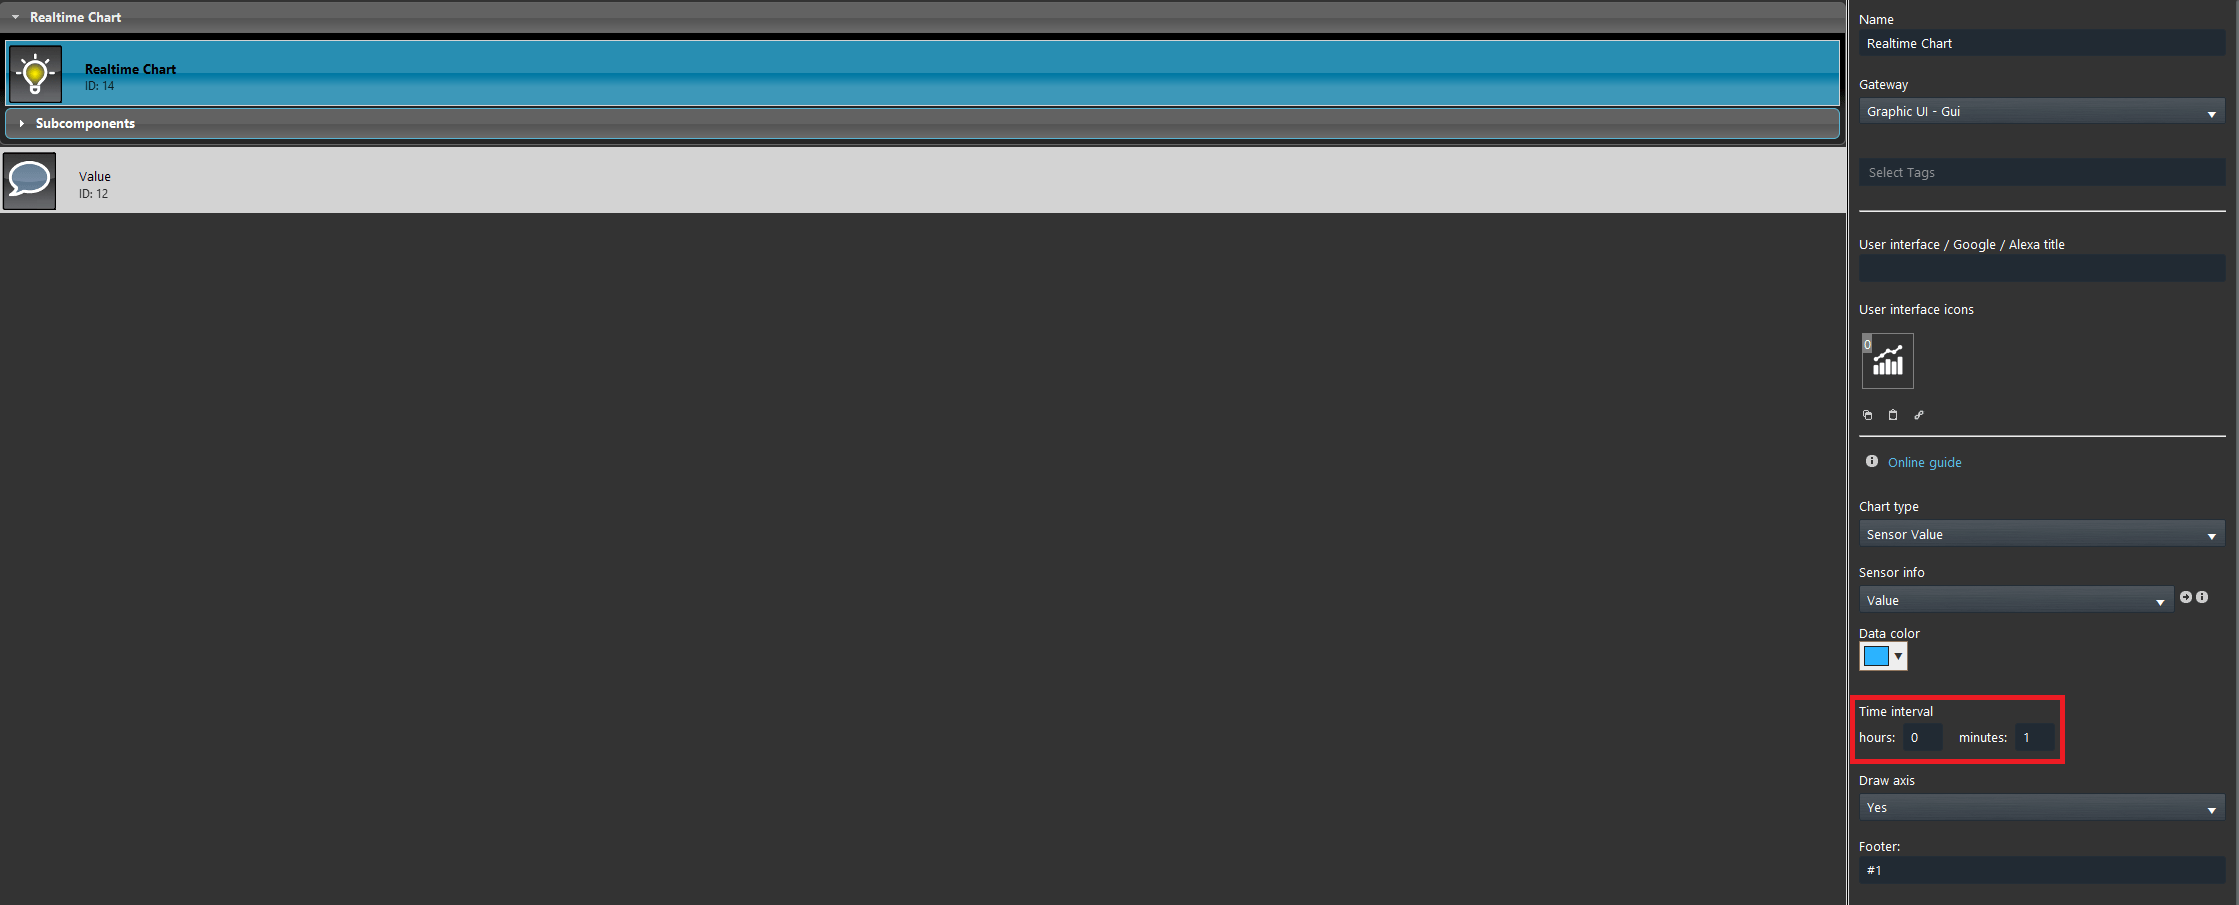
Set the Time Interval, this will set the interval which the data will be shown within the interface.
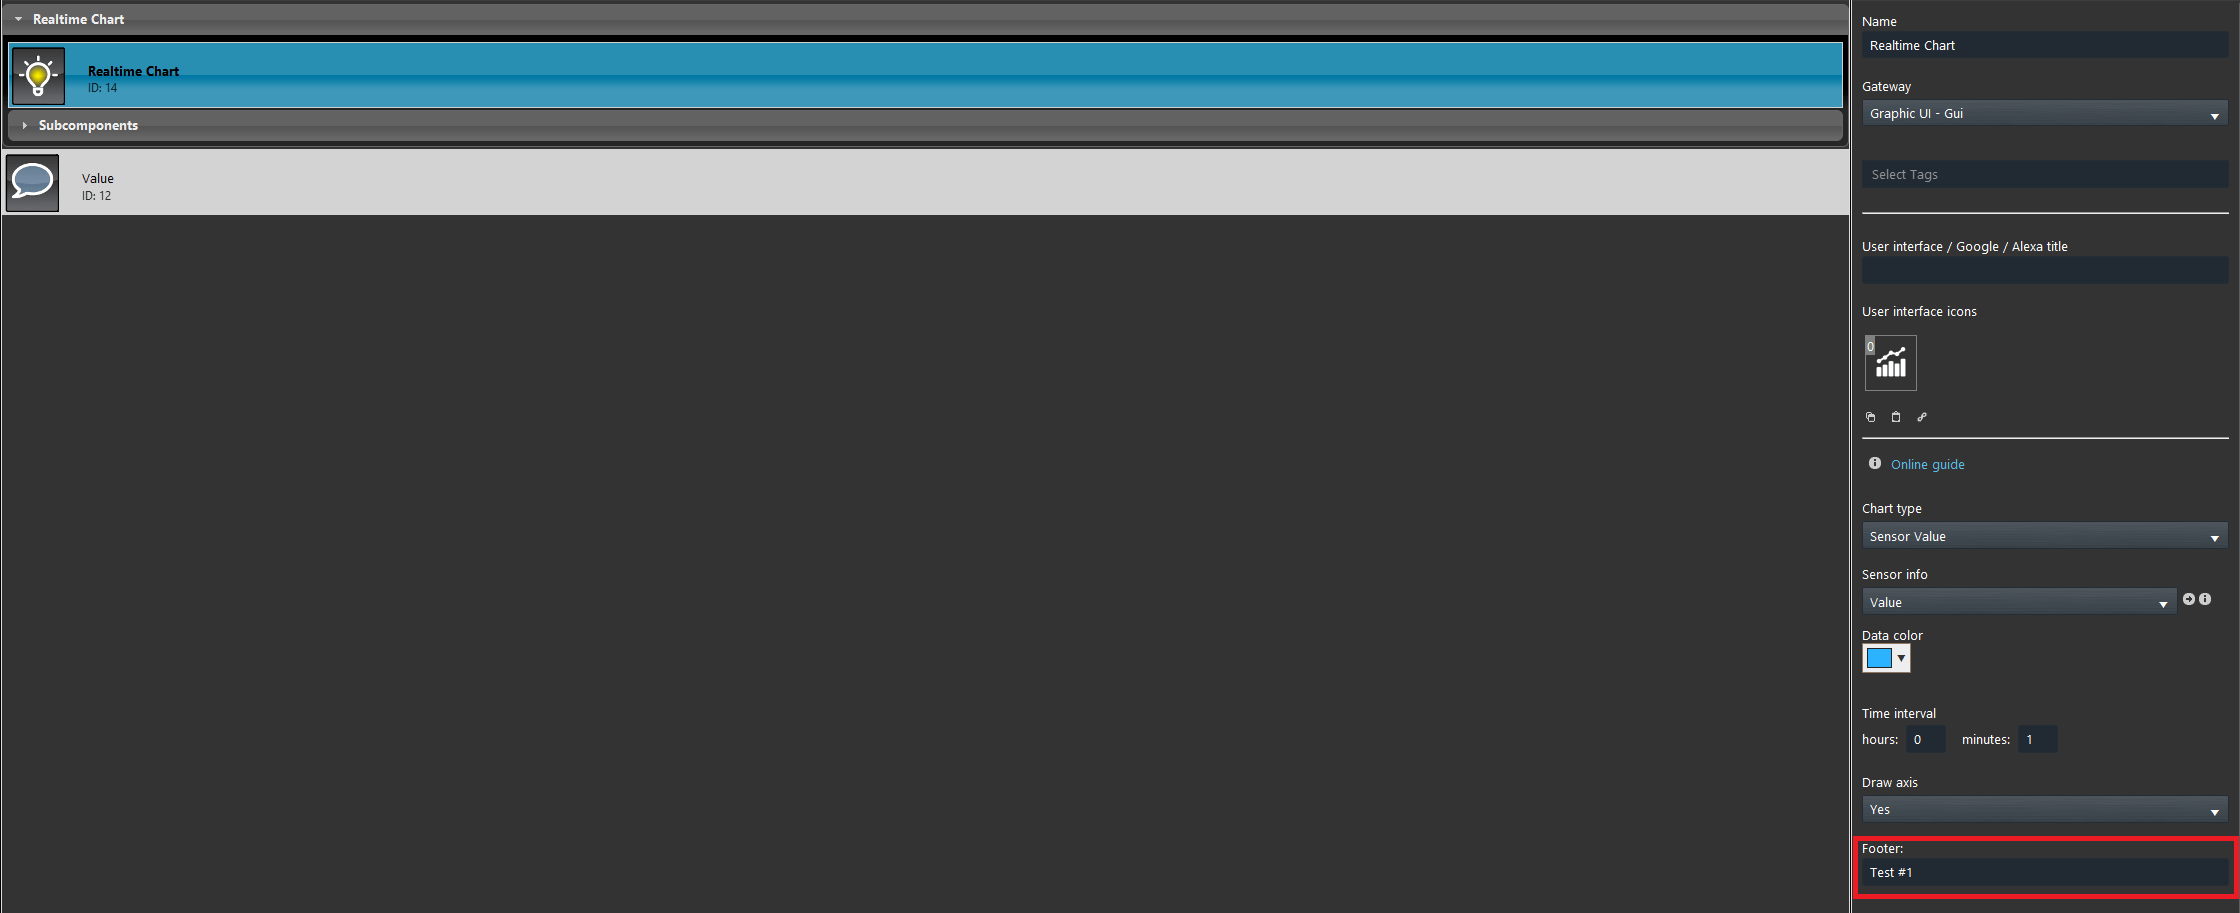
Apply a footer to the Real Time Chart, followed by the “#1” character that will include the Information value within the footer position. This text will be applied as label to the value within the Ilevia control app.
Visual result
As you can see in the picture below, the value displayed within the Chart is refreshed respectfully to the time you set inside the Time Interval of the Ilevia Control App.
Click the link below to download the Real time chart demo project and try it your self.


