 Report
INTRODUCTION
This component allows you to create reports using gathered information and to display them into an Excel file. Each information deriving from a specified component can be used to be represented in a chart and can be sent through Email on Daily, Weekly, Monthly or Yearly basis.
USE CASES
- The user wants to send an email with monthly report of the its home energy consumption.
- The user wants to get a weekly report about the energy consumption made inside its home.
REPORT GROUP CREATION
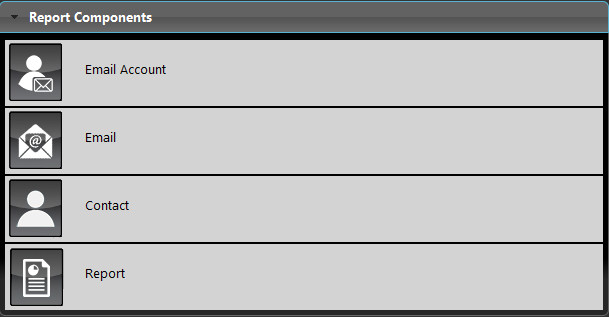
As always you are asked to drag and drop the required components on “My components” area. The particularity of this component is given by using different components into a single group to get the job done. As the image on the left, you can see the needed components (Email Account, Email, Contact, Report).
Note:
In this guide, we will only cover the “Report” component. For the other components configuration please refer to those guides:
COMPONENT’S PROPERTIES
GUI
This component’s sample is made by using Graphic UI gateway.
Please refer to “Gateways / Protocols” chapter in order to get further info.
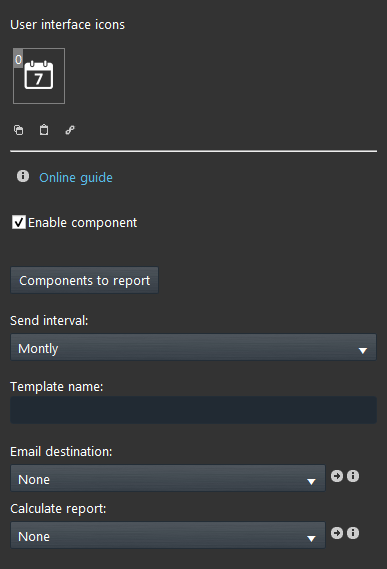
Send interval: This option let you choose to send a report in a Daily, Weekly, Monthly or Yearly basis;
Template name: You can use ilevia_energy to use an already made template;
Email destination: Select the Email component that you have configured;
HOW TO CONNECT TO YOUR SERVER TROUGH THE SFTP PROTOCOL
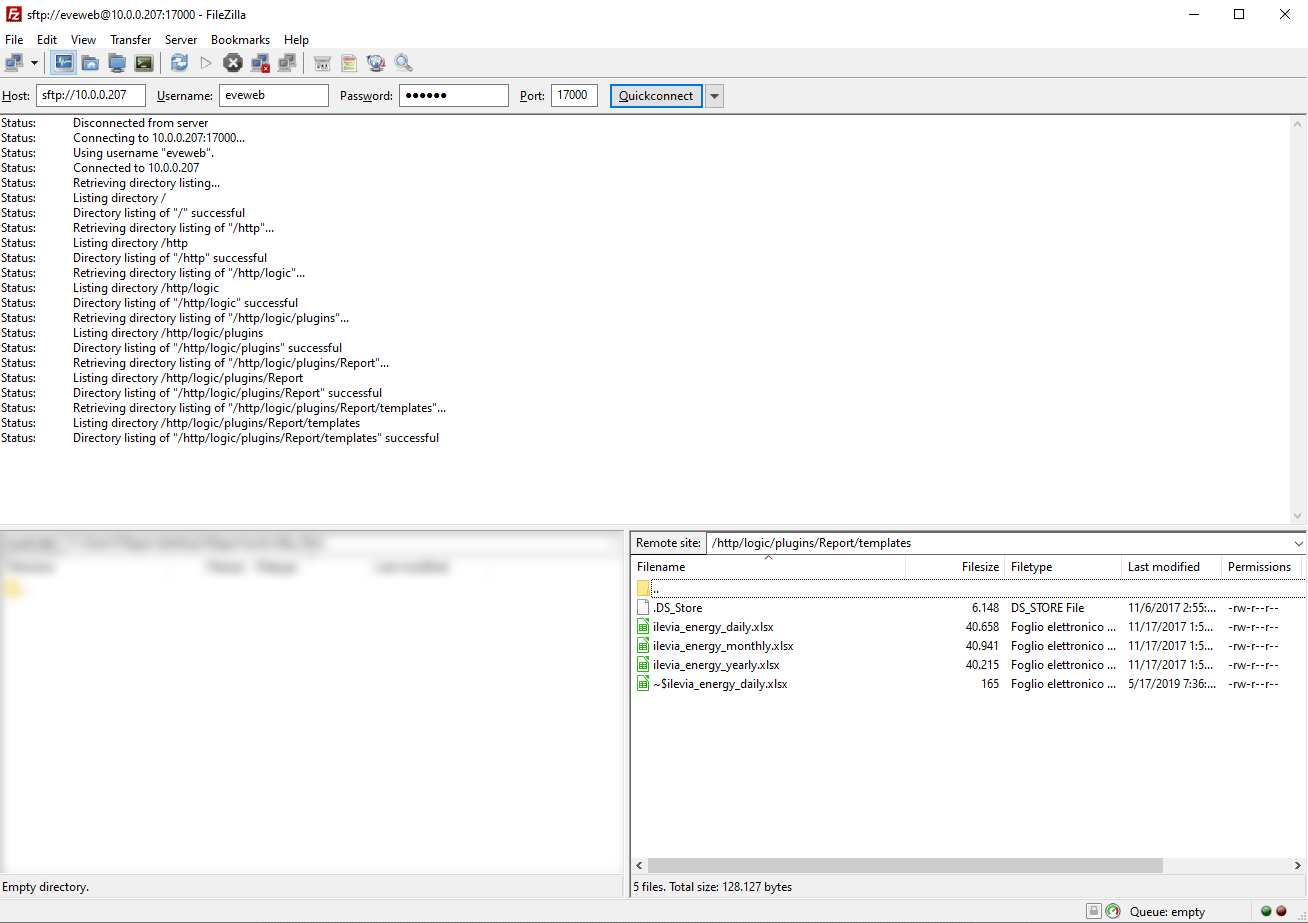
In order to export the Report file you will need to make a SFTP connection towards the EVE server, this is carried out with open source softwares such as Filezilla (available for windows and MacOS).
In order to connect inside the SFTP server you will need to put in the Host field “sftp://” followed by the IP address of the server, as Username and Password enter eveweb, finally press Quick connect.
Once connected, in the Remote site bar you will find all the folders presents in the server, head to /http/logic/plugins/Report/templates and you will find the template you have created in EVE Manager, Double click on the file to donwload it on your computer.
HOW TO MAKE YOUR OWN DAILY ENERGY REPORT
In this part of the guide, we will explain how to customize and make your own report.
After you have downloaded the file, for example, ilevia_energy_daily.xlsx from your server you can start editing it, so you can have your own data and layout. Below you’ll find the steps to follow to customize it:
- Open the ilevia_energy_daily.xlsx
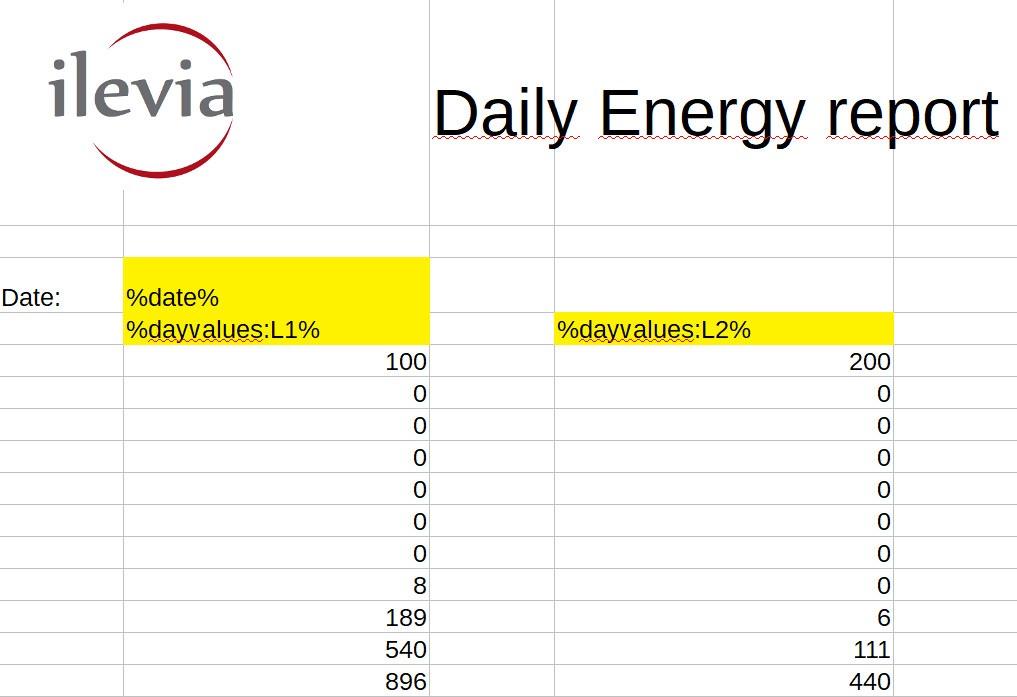
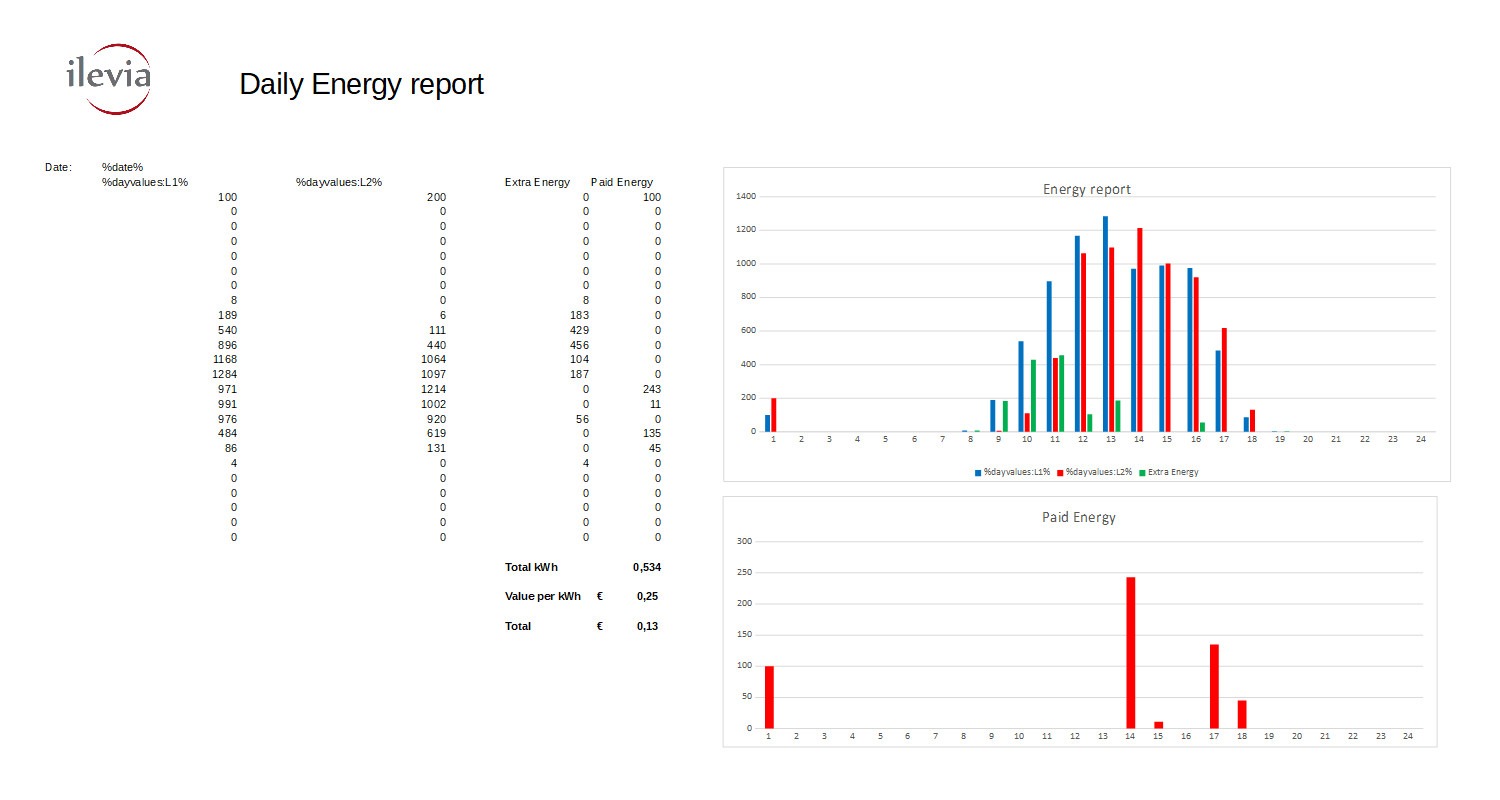
- %data% will display the date in which the Report has been created in. %dayvalues:L1% will display the data recorder from the first component inserted inside the report component list. The “Recorder” component is mandatory to collect data, it’s really important to understand this component before continuing. Remember that a recorder store data during a specific interval of time, that you can set according to your needs.
- Remember that you can utilize a ready to use template that we provide to accelerate the process (the SFTP file path is /http/logic/plugins/Report/templates).
- Remember that after you have edited it upload the ilevia_energy_daily.xlsx into your server using Filezilla (just drag and drop the file into the templates folder and overwrite it).
%date%
Rappresent the date of the report.
%dayvalues:L1%
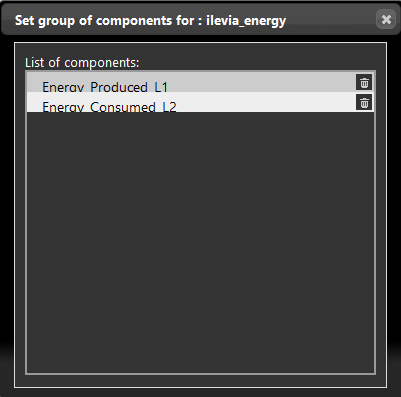
Is the value of the 1st component of the “Components to report window”. In this case ,looking at the image below, you will see that %dayvalues:L1% (L1 mean LINE1) the second value will be %dayvalues:L2% (L2 mean LINE2) etc. . For this example, we used two “Recorder” to collect the data and two “Info” components to show the data. You can add as many input as you want inside the template. In the other template the input syntax differs depending to the timelaps choosen. If the timelaps is month the right input syntax is %monthvalues:L1%, instead in the yearly the syntax is the following: %yearvalues:L1%.

